

24/7 Phone Support
(231) 591-4822
Toll Free: (877) 779-4822
Walk-up Support
8 a.m. - 4:30 p.m.
UCB 108
IT Core Service Support
8 a.m. - 5 p.m.


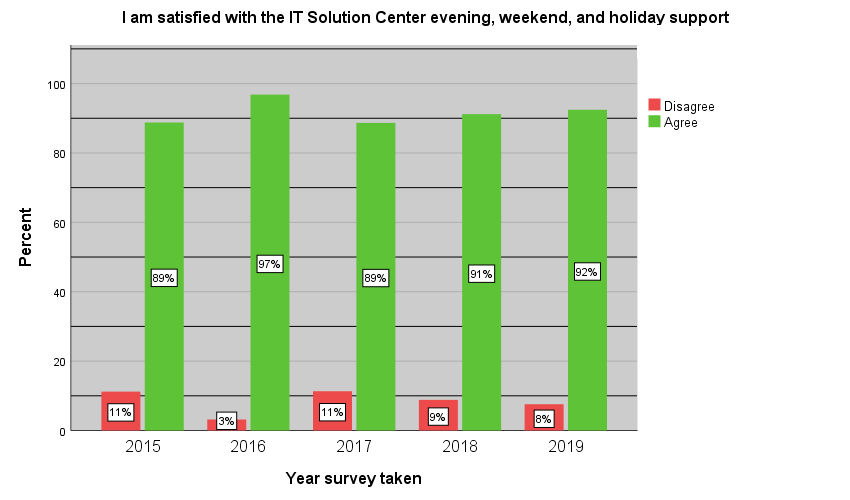
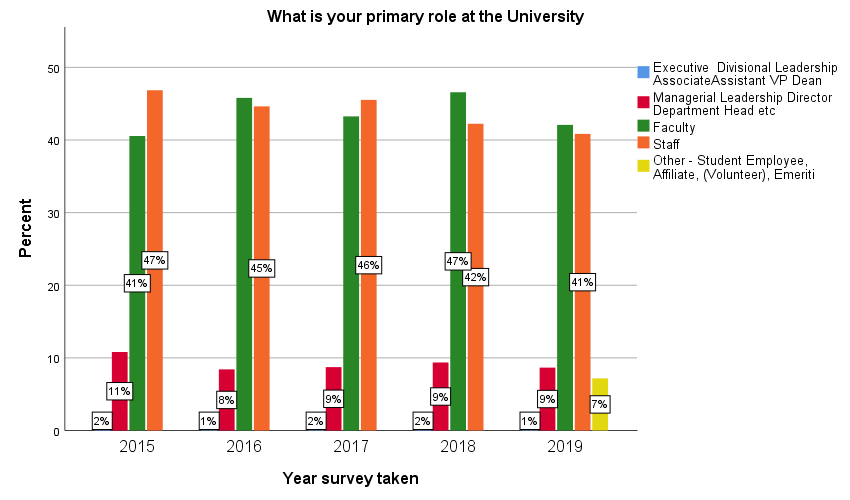
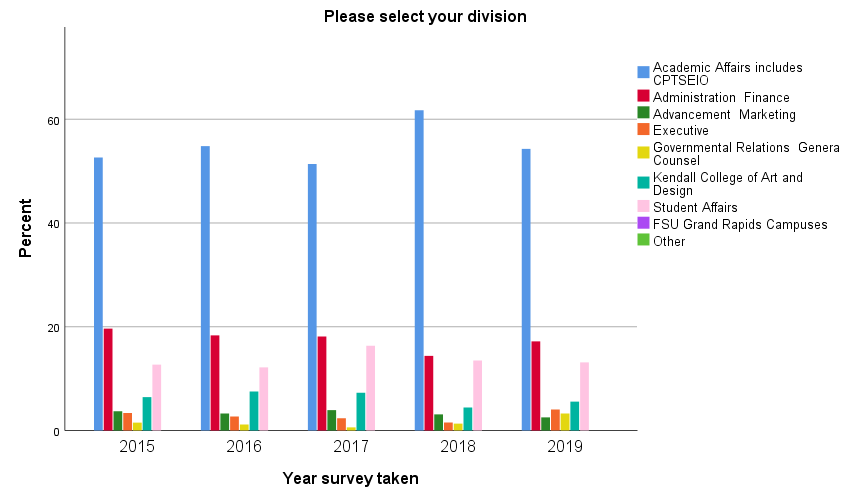
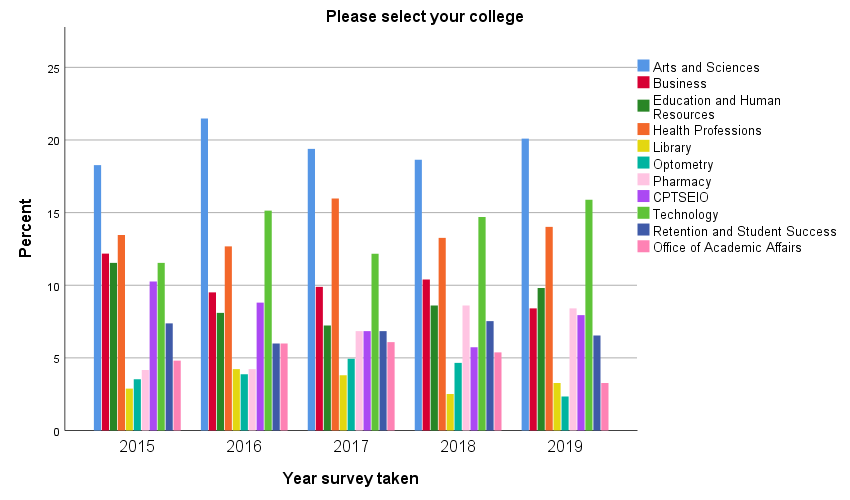
Each Spring semester, ITS sends a survey to the employees of the University. We ask the same questions each year, for the most part. Here are charts that show the responses for the past five years, side by side.
For the Y axis, any opinion question is displayed in a percentage. This includes the demographic role, since that question is 100% of N, the number of responses.
2015, N=567
2016, N=500
2017, N=529
2018, N=467
2019, N=403
2020, N=368
2021, N=1662
Q1. The process for requesting IT support is efficient

Q2. IT Support has responded to requests in a timely manner

Q3. I am comfortable with student employees assisting with support requests

Q4. IT support does a sufficient job communicating various technology issues

Q5. I am satisfied with the IT Solution Center

Q6. I am satisfied with desktop support

Q7. Overall I am satisfied with the IT support that I receive

Q8. Comparing my IT services with previous years, my service has:

Q9. I am satisfied with the IT Solution Center evening, weekend, and holiday support.
ITS Annual Survey - Respondents by Role
ITS Annual Survey - Respondents by Division
ITS Annual Survey - Respondents by College
ITS Annual Survey - Student Affairs Respondents by Department

ITS Annual Survey - Admin and Finance Respondents by Department

24/7 Phone Support
(231) 591-4822
Toll Free: (877) 779-4822
Walk-up Support
8 a.m. - 4:30 p.m.
UCB 108
IT Core Service Support
8 a.m. - 5 p.m.